
Features
The NuVu Query Tool is a flexible, user-friendly database query tool that can be used to interrogate data from the underlying database(s). Unlike many other query tools, the administrator can “hide” database tables and/or fields so that users are only able to extract data from a subset of the database. Furthermore, tables and/or fields are able to be renamed to more user-friendly names. Once a user has created a query, the query can be optionally saved to the repository, and re-run at any stage thereafter, without having to redefine the whole query. Ad-hoc queries can be defined and run, without having to save the query to the repository.
The Query Suite comprises:
- A Repository tool (Click for more info)
- A Progress Adapter for communicating with the Progress database(s)
- A Query designer tool (incorporating an internal report writer)
- An end-user Run-Time query selector (can be integrated into your application)
- A User Administration tool (can be integrated into your application)
- Direct export of results to Excel, CSV or XML
- Direct interface (at no cost) to the
- NuVu Reporting Suite
- Powerful Charting capability
- Full drag-and-drop interface
- A Query Scheduler
Continuing development of new features available as downloadable upgrades
Once a query has been executed, the results can either be viewed within the Query tool, exported to Excel (in native Excel format, or comma-separated fields), exported to XML or sent through to the NuVu Reporting Engine where they may be printed, emailed or faxed.
The results that are shown in the primary grid (the top most grid) are also able to be charted using either a bar or pie chart.
Query: Example
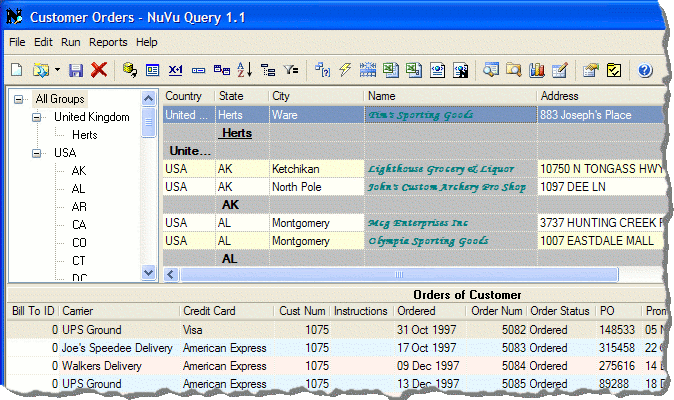
This is an example of what is displayed in the query window once a query has been defined and executed. Although not perhaps the most visually appealing layout, the example serves to illustrate the capabilities of the query tool. Note the columns are shown in different font styles and colors.
Columns can simply be dragged to a new destination with the mouse. Right-clicking on the column header (ie: the column label) of any column will present the user with a properties window where the individual settings can be changed for the selected column.
The background banding colors of all three data grids are able to be customised to your liking. Other settings (like the preferred Excel settings) are also able to be changed.
The query window can be resized to any dimensions, as well as the height of the individual data grids. These settings are automatically remembered on a per query basis.
Query: Chart Example
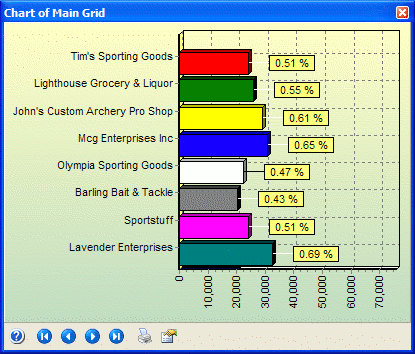
This example shows the functionality of the charting option. A Bar or Pie chart is able to be rendered from any two columns in the MAIN data grid (the grid at the top of the Query window.
There are various settings that are able to be advised for the chart – these being available when clicking the ‘Properties’ toolbar button on the bottom of the chart window.
The chart window remains ‘on-top’ of all other windows, and is able to be resized to any preferred dimensions. The contents of the chart are automatically resized when the chart window is resized. These settings are automatically saved when the query is saved.
The chart is also ‘hot-clickable’. Clicking on any piece of the pie, or any bar of the chart will result in the main data grid on the query window being repositioned to reflect the data row that is represented in the chart.
Query: Excel Example
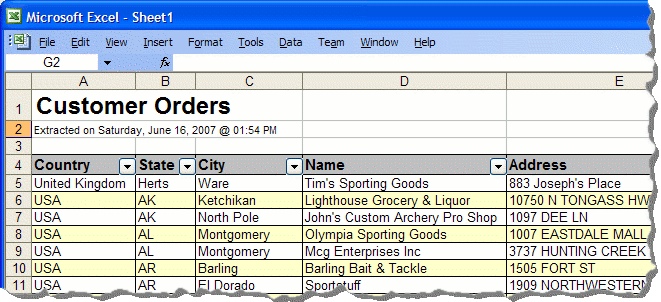
This example shows the functionality of the ‘Export to Excel’ option.
The Excel spreadsheet is auto-formatted as per the columns contained in the query window. The background banding colors from the query window can also optionally be used within the spreadsheet. All numeric columns are automatically summed and the total shown on a separate row at the bottom of the spreadsheet. Each column is also filtered, so that the user is able to further filter the data within the spreadsheet.
Please note, if there is more than a single data grid in the query window, then the results will be flattened when they are exported into the Excel spreadsheet. For example, assume we had created a query that showed all customers in the main grid, then the orders of the selected customer in the second grid – when this information is exported into Excel, the customer information for all orders of that customer will be repeated in the spreadsheet.
Query: NuVu Report Example
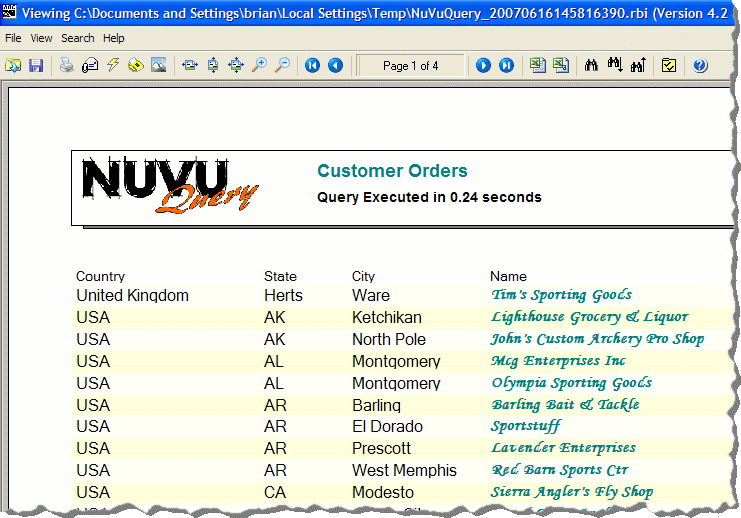
This example shows the functionality of the ‘Export to NuVu Report’ option.
The NuVu report is dynamically generated, based on the attributes of each column in the query. All font attributes (style, color and size) are replicated from the data grid to the NuVu Report. The hierarchical breakdown of the data (eg: Customers, Orders of selected Customer etc) are also faithfully represented in the report.
All the normal functions available within the NuVu Report previewer are available to use – including exporting to Excel, Faxing, Emailing, saving to PDF format etc.
There is NO requirement for NuVu Report licences in order to utilise this function. However, custom reports (and forms) can be optionally designed and used if the NuVu Report Designer is purchased. Please contact your NuVu Sales representative for more details.
Query: Select Data Sources

This function is used to select (or de-select) databases (data sources) you wish to include in the current query.
The selection window comprises two separate panes – a list of available items on the left, and a list of selected items on the right. Your system administrator is responsible for setting up the available items that appear in the left pane.
The complexity of advising the actual connection parameters required for a particular database is also the responsibility of the system administrator – all the user has to do is select from the database names shown in the right-hand pane. The entries show the defined database, and are followed by the internal database schema name. This schema name can be shared across databases. This is a handy feature that allows you to select the actual database from a list of databases that share the same database schema when you run the query.
Query: Select Tables

This function is used to select (or de-select) tables you wish to include in the current query.
The selection window comprises two separate panes – a list of available items on the left, and a list of selected items on the right. Your system administrator is responsible for setting up the available items that appear in the left pane.
The system administrator can hide tables that are never used in queries, and can also rename existing tables so that they are more descriptive to the user of the query tool.
This function uses multiple mechanisms for selecting (or de-selecting) items from the available and selected panes – either simply double-click any item to select/de-select it, or use the mouse to highlight a section and then either click the transfer buttons, or simply drag the items to the other panel.
Query: Define Table Joins
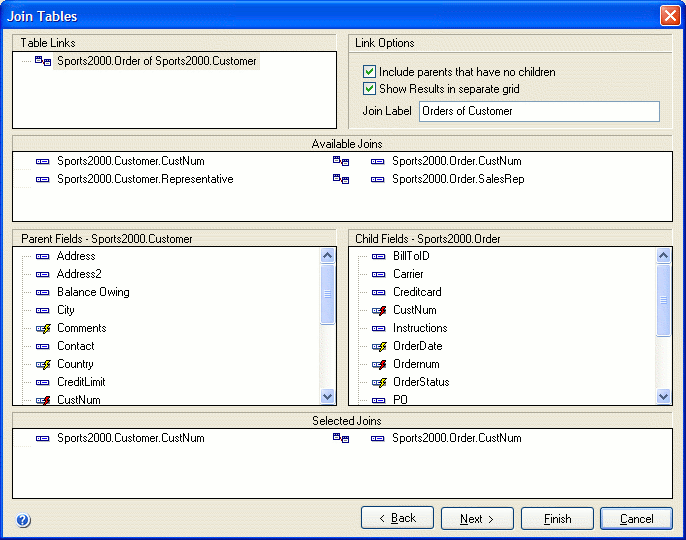
This function is used to advise the table joins between each table included in the current query. This function is only able to be invoked if there is more than a single table defined within the query. Also, if the current user is not able to advise manual table joins, this window will still display the available joins, and the automatically selected PRIMARY join, but the user will not be able to change any information.
A join is defined as the logical relationship between two tables. For example, if you have a customer table and an order table, the relationship would be based on the common customer ID that existed in both the customer table and the order table.
When tables are added to the query by the user, the NuVu Repository will be interrogated to determine all the joins that exist between the two tables. Any joins that are marked as PRIMARY joins will be automatically chosen for you. Primary join fields are shown with a red lightning bolt through the field icon. Fields that are indexed are shown with a yellow lightning bolt.
Query: Select Fields

This function is used to select (or de-select) fields you wish to include in the current query.
The selection window comprises two separate panes – a list of available items on the left, and a list of selected items on the right. Your system administrator is responsible for setting up the available items that appear in the available pane.
The system administrator can hide fields that are never used in queries, and can also rename existing fields so that they are more descriptive to the user of the query tool.
This function uses multiple mechanisms for selecting (or de-selecting) items from the available and selected panes – either simply double-click any item to select/de-select it, or use the mouse to highlight a section and then either click the transfer buttons, or simply drag the items to the other panel.
Query: Define Filters
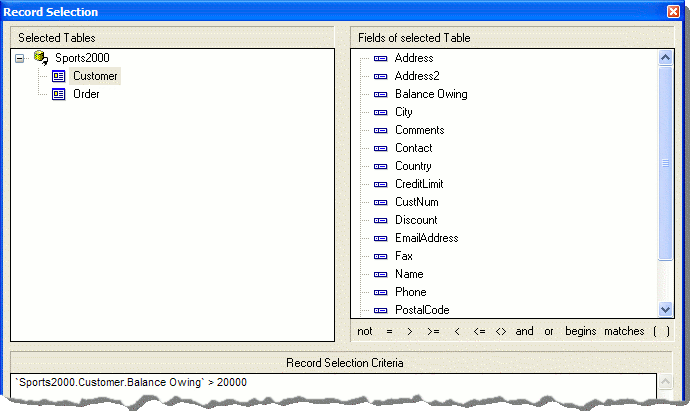
This function is used to advise the filters (record selection criteria) that are to be applied to each selected table in the current query.
The left-hand pane displays a tree-view of all selected tables in the current query. The right-hand pane contains a list of all fields in the currently highlighted table (from the left-hand pane). The ‘Record Selection Criteria’ text-box below the two panes is a user-defined list of conditions to apply to the selection of records in the current query.
The ‘Record Selection Criteria’ text-box is a free-form input area for advising the actual record selection criteria. This input area is able to be manually typed, but there are various mechanisms in place to assist the user in the building of the criteria.
Query: Advise Sort Sequence

This function is used to advise the filters (record selection criteria) that are to be applied to each selected table in the current query.
The left-hand pane displays a tree-view of all selected tables in the current query. The right-hand pane contains a list of all fields in the currently highlighted table (from the left-hand pane). The ‘Record Selection Criteria’ text-box below the two panes is a user-defined list of conditions to apply to the selection of records in the current query.
The ‘Record Selection Criteria’ text-box is a free-form input area for advising the actual record selection criteria. This input area is able to be manually typed, but there are various mechanisms in place to assist the user in the building of the criteria.
Query: Optional Grouping
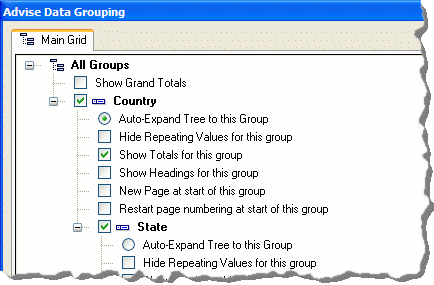
This function is available only if the user has chosen to sort by at least one field. The function allows you to choose various settings for each group, including whether totals and headings will be shown for the group(s).
Grouping is a powerful feature of the Query Designer, in that grouping is able to be rolled-up or rolled-down (also known as drill-down) when the results of the query are displayed within the Query grid(s). In addition, a separate group tree-view will be displayed to the left of the results in each applicable grid, allowing the user to quickly navigate to the results of the desired group.
Query: Group Header/Total Designer

A very powerful feature of the Grouping function (described in the previous paragraph) is the ability to design custom Heading and Total layouts that will be used when the results are sent through to the NuVu Reporting Suite.
On right-clicking the mouse on a ticked ‘Show Headings’ or ‘Show Totals’ Grouping option on the Group dialog window, a designer is presented (as shown in the screenshot above) that offers the user the ability of drawing rectangles, lines, bitmaps, logo’s and labels, as well as fields from the results grid. This designer is a cut-down version of the full NuVu Report designer and offers comprehensive formatting capability, including conditional processing and barcoding.
Query: Calculated Fields
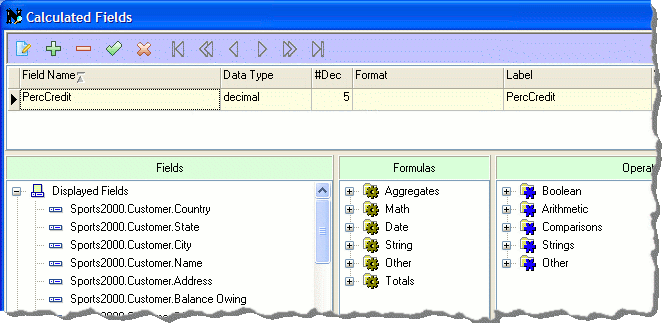
This function is used to advise the calculated fields that are to be attached to the displayed grid(s).
There is a very comprehensive set of functions and operations that are able to be used against the database fields of the query.
There is also helper functions for building the calculated field. All functions have tool tips that display the full syntax of each function – the user just has to hover the mouse over the function to reveal the syntax.
