

Tutorial 12
Adding conditional formatting to field objects on the report
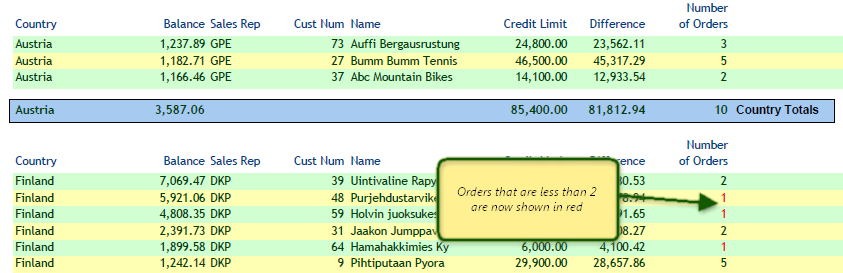
This tutorial assumes you have the knowledge gained from working with the previous tutorials. After this tutorial you will have the ability to invoke the internal report designer and add conditional formatting to any field object of the report. For the tutorial we are going to add logic that will show the ‘Number of Orders’ column of all customers with only one order in a red foreground color.
Perform the following steps:
- If the Query Designer Tool is already running, please close it down. Invoke the NuVu Query Designer from the NuVu Query program group from the windows Start menu. The main NuVu Query Designer window will be displayed, and a welcome dialog window will also be displayed that shows recently saved/opened queries. We are going to create a new query from the previous query (tutorial11), so double-click on the ‘tutorial11′ item that should be displayed inside the Welcome dialog window (if you have successfully performed the previous tutorial and saved it as specified in that tutorial with a name of‘tutorial11′). The original query will open inside the Designer. We need to now save this as ‘tutorial12′ before we start working with the query, so click on the File->Save As menu item and advise a new Query name of tutorial12 when the save properties are displayed.Click the
 button to save the query with the new advised name (tutorial12).
 - Click the
 button to start the execution (running) of the query. This step will create a set of results that we can use when we are within the internal report designer later on in this tutorial.
 - Click the
 (Report Designer) button on the toolbar to invoke the internal Report Writer for this query. The internal Report Writer is a banded report designer similar to other reporting products, that shows each defined section in its own band (for example, the Page Header has its own band, the Details section is shown in a separate band, and each total section is also shown in a separate band). The example shows the bands that have been manipulated in terms of their leading and trailing spaces, and rectangles beneath the totals section as performed in Tutorial 10 and Tutorial 11:
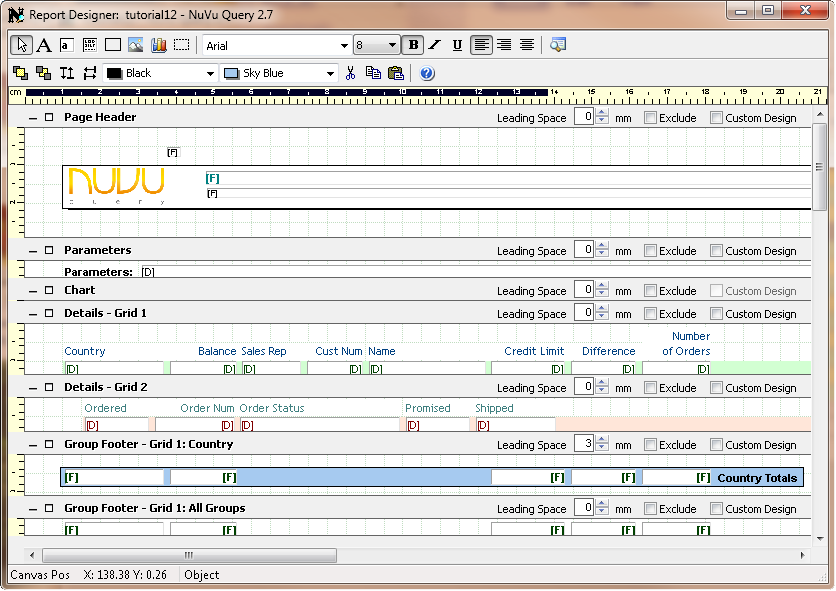
- Preview the current design by clicking the
 (preview) button on the extreme right of the toolbar menu to view the report as it would appear to the user in the current default format.Because there is now a second grid in this query, a dialog window will appear asking you if you wish to see the second grid details in the preview. To keep things simple, we are not going to show the second grid details, so untick the ‘show details from second grid’ as shown below:
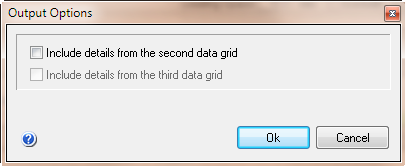
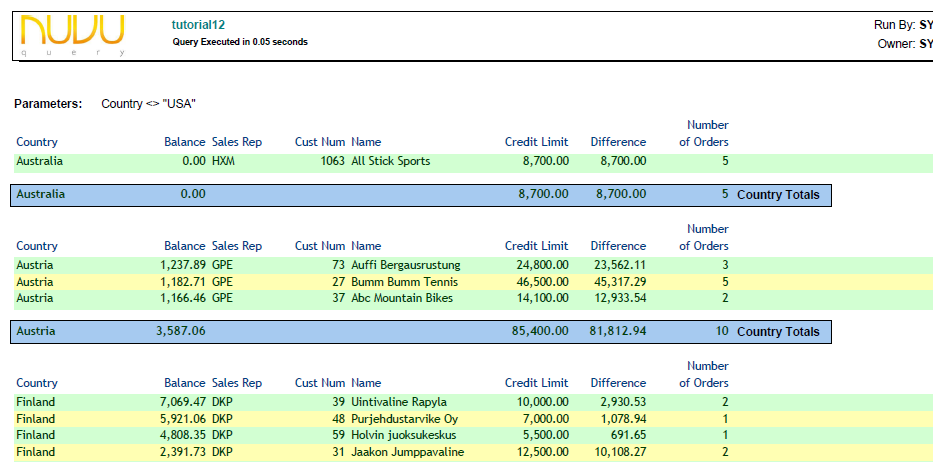
- The PDF or NuVu previewer should now open with the report, as shown below:
- In order to define conditional formatting against any field object, the section containing the field object needs to be made a ‘custom section’. Move the mouse down until it is in the header area of the ‘Details – Grid 1′ section, and then tick the ‘Custom Section’ tick-box. A warning message will then be displayed indicating that once you make the section a custom section, changes made to the actual query will not automatically be reflected in this section. Click the Yes button to acknowledge this message.
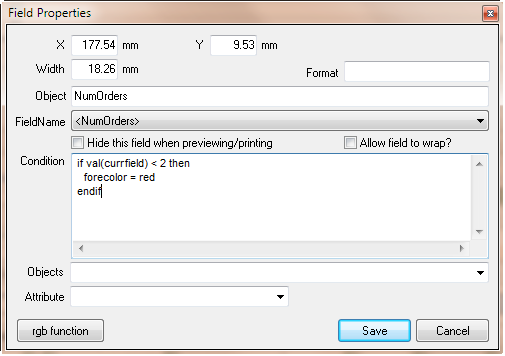
- Next we need to invoke the properties window for the ‘Number of Orders’ field. Move the mouse so that its anywhere within this field and then right-clickthe field. Handles (little black indicators) will appear around the object, and the properties dialog will appear for this selected object. Advise the text inside the ‘Conditions’ text-box as shown exactly in the example below:
- Click the SAVE button to save the changes to the field properties window to close this window (while retaining the changes that you have just made).
- Preview the current design by clicking the (preview) button on the extreme right of the toolbar menu to view the report as it would appear to the user in the current default format.Because there is now a second grid in this query, a dialog window will appear asking you if you wish to see the second grid details in the preview. To keep things simple, we are not going to show the second grid details, so untick the ‘show details from second grid’ as shown below:
- The PDF or NuVu previewer should now open with the report, as shown below:
- We are now finished with the tutorial but need to save the changes that have been made to the report designer, so click the
 (close) button at the top right hand corner of the designer window to close down the designer screen. If any changes have been made, then you will be asked if you wish to save these changes (in memory) or discard them. In this case we would like to save the changes so choose that option.
 - Finally we will save the changes made to this query including the changes made to the internal report writer (as this will form the base query for the next tutorial), so simply click the
 button and close down the query tool.
We are complete with the tutorial. An exported query containing this tutorial is available by right-clicking here and choosing Save Link As (Firefox) or Save Target As (Internet Explorer) to save the query import format file to a file on your hard disk, and then importing that query into the query tool (hint: choose File->Import Query from the main menu of the Query Designer).
End of Tutorial