

Tutorial 18
Creating a chart based on selected columns
This tutorial deals with the creation of a chart that is based on ‘Selected Columns’ instead of the normal row-based chart. It is important to realise that charts that are based on ‘Selected Columns’ ALWAYS derive the information from the TOTALS of the selected columns, and that only columns that are of type integer or decimal are allowed to be selected.
- Invoke the NuVu Query Designer from the NuVu Query program group from the windows Start menu. The main NuVu Query Designer window will be displayed, and a welcome dialog window will also be displayed that shows recently saved/opened queries. We are going to create a new query from scratch, so ensure that the ‘Start a new Query’ option is selected and then click the OK button.
- Select the Sports2000 database from the list of available datasources by hi-lighting the Sports2000 entry in the ‘Available’ list of items, and then double-clicking to transfer to the list of ‘Selected’ items. If you have started from a fresh install, the Sports2000 datasource will be the only available one to choose.
- Click the
 button to proceed to the next step. You will now be presented with a list of ‘Available’ tables to select from. This tutorial will only demonstrate the extraction of data from a single table, so double-click the ‘Salesrep’ table to select and transfer it to the list of ‘Selected’ items.
 - Click the button to proceed to the next step.
- You will now be presented with a list of ‘Available’ fields to select from. Please select all the ‘MonthlyQuota’ fields on this table, by either double-clicking each item to transfer it to the list of ‘Selected’ items, or hold down the control key and click on each of the fields and then hold down the left mouse button and drag them across to the ‘Selected’ panel and then release the mouse button to drop them onto the list. The result should look like this:
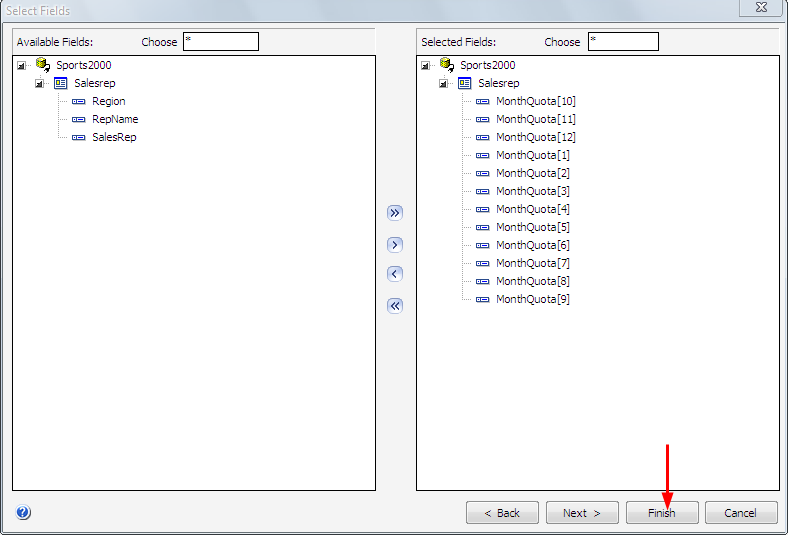
- Click the
 button to end the query wizard.
 - You will now be presented with a grid showing the fields that you selected in the previous step. We will now demonstrate how to change any of the column-labels from their defaults to any user-defined value. Remember, for column-based charts, the labels for each element of the chart will be fetched from the column-labels on the grid, so changing the labels on the grid will also change the labels on the chart. We will amend the column label of the ‘Month Quota[2]‘ field to represent ‘February’. Place your mouse cursor onto the column label of the ‘Month Quota[2]‘ field and right click to present the ‘Column Attributes’ dialog window. Search for the ‘Label’ field and place your mouse cursor inside the edit box, hi-lighting the description and replace that text with‘February’, as shown in the sample screenshot below:
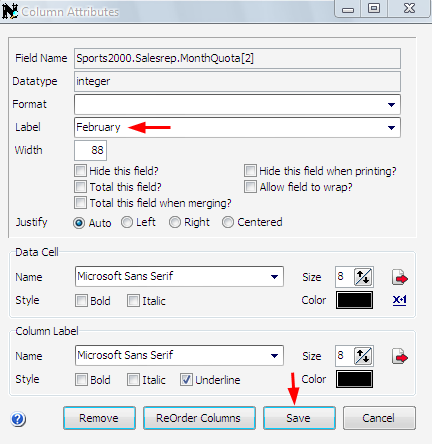
- Click on the
 button to save the change made to the ‘Label’. This will close the ‘Column Attributes’ dialog window. The column label shown on the grid should now reflect ‘February’.
 - Click the
 button to execute the query. The results of the query should then show in the grid.
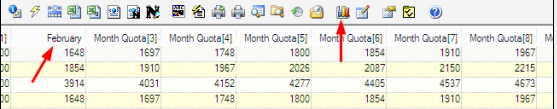
- We will now click the
 to chart the grid results. The chart dialog window will open but will contain a blank chart.
 - Click on the
 button to open the Chart Properties dialog window.
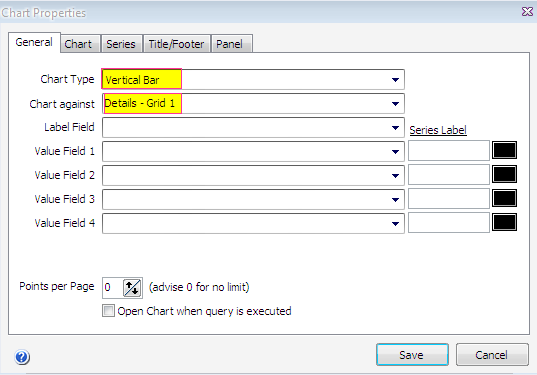
- By clicking the drop down box on the Chart Type field, the type of chart can be selected. For the purposes of this tutorial we will choose ‘Vertical Bar’.
- On the Chart against drop-down box, select Selected Columns. The dialog window will hide a few other fields that are not applicable to ‘Selected Columns’ charts, and a ‘Select Columns’ button will appear.
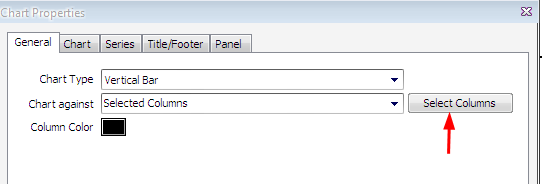
- Click the ‘Select Columns’ button to invoke the ‘Column Chooser’ dialog window.
- We now need to select which of the available fields that have been defined for this query are to be included on the chart. Select all the ‘MonthlyQuota’fields, by either double-clicking each item to transfer it to the list of ‘Selected’ items, or holding down the control key and clicking on each of the fields and then hold down the left mouse button and drag them across to the ‘Selected’ panel and then release the mouse button to drop them onto the list of selected items.In addition we can also alter the position that each column will be shown on the chart. To illustrate, we will now move the ‘Month Quota[2]‘ field to the second position in the selected list of columns. Place your mouse on the ‘Month Quota [2]‘ field and hold down the left mouse button and drag this field to the second position, and then release the mouse button.
- Click the button to close the ‘Column Chooser’ dialog window.
- Click on the button to save all changes made to the chart properties to memory. At this point, the chart should be visualized onto the chart dialog window. On the right hand side of the chart, the chart legend will show, and you should see the ‘February’ element in the second position. The chart dialog window can now be resized to your requirements (the size of the chart dialog is saved along with the rest of the query.
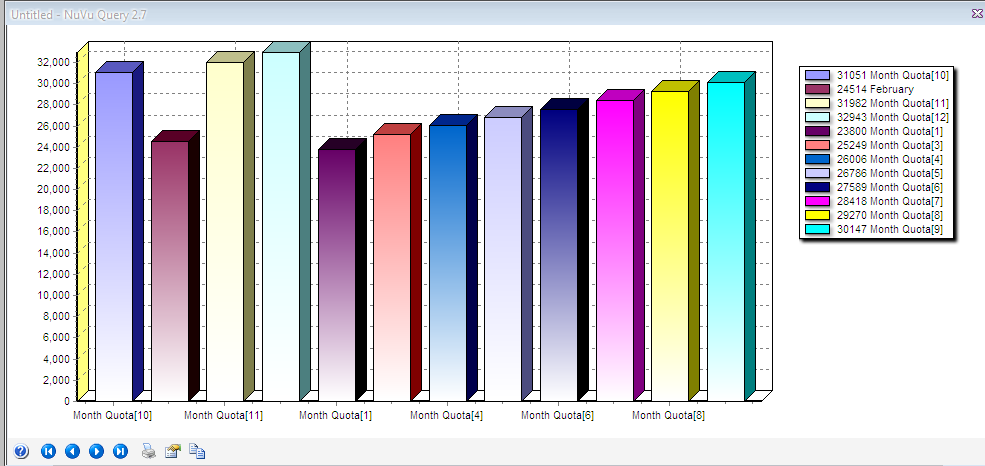
- Notice the labels at the bottom of the chart are overlapping each other, and also we have no marks above each element of the chart. To rectify this, click on the button to open the ‘Chart Properties’ dialog window. We will now select the Series tab to make a few changes.
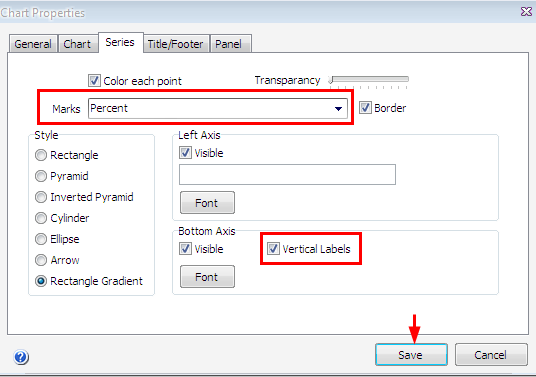
- Firstly we will drop down the ‘Marks’ combo box and select ‘Percent’. Next we will tick the ‘Vertical Labels’ option. Click on the button to save the changes to memory and close the chart properties dialog.
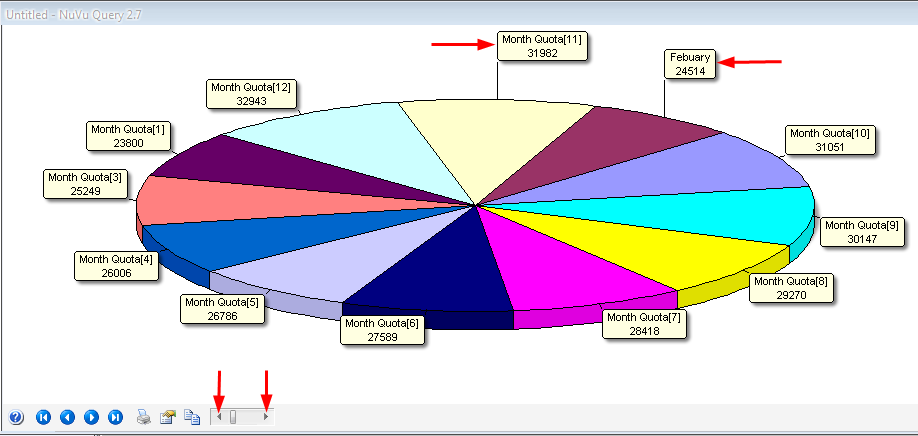
- Lastly we will illustrate how to change the chart type. Click on the button to open the Chart Properties dialog window. Drop down the Chart Type combo box and select ‘Pie’ and once again click save. The chart will now appear as a pie. By placing your mouse on any of the labels they can be moved away from the chart. By clicking either the left or right arrow keys on the slider bar,the pie chart can be rotated either left or right.
- Finally we will save this query, calling it tutorial18 as this query will form the basis for all other tutorials in this set. Click on the
 button to save the query – the standard query properties window will be displayed – so on this window just advise a query name of tutorial18 and then click the OK button to save the query.
We are complete with the tutorial. An exported query containing this tutorial is available by right-clicking here and choosing Save Link As (Firefox) or Save Target As (Internet Explorer) to save the query import format file to a file on your hard disk, and then importing that query into the query tool (hint: choose File->Import Query from the main menu of the Query Designer).
End of Tutorial