

Tutorial 15
Creating and customising your first Dashboard
In this tutorial we are going to create and customise a Dashboard. After this tutorial you will have the ability to customise the dashboard to your specifications by adding your company logo, inserting a title and changing the colors and other attributes of the Dashboard.
The NuVu Dashboard is a tool that will display multiple NuVu Query objects (and optional RSS feed objects) in a single containing window. The Dashboard has toolbar buttons that allow individual functions (like exporting to Excel, printing, previewing etc) on any selected object contained within the dashboard.
To perform this tutorial, follow these steps:
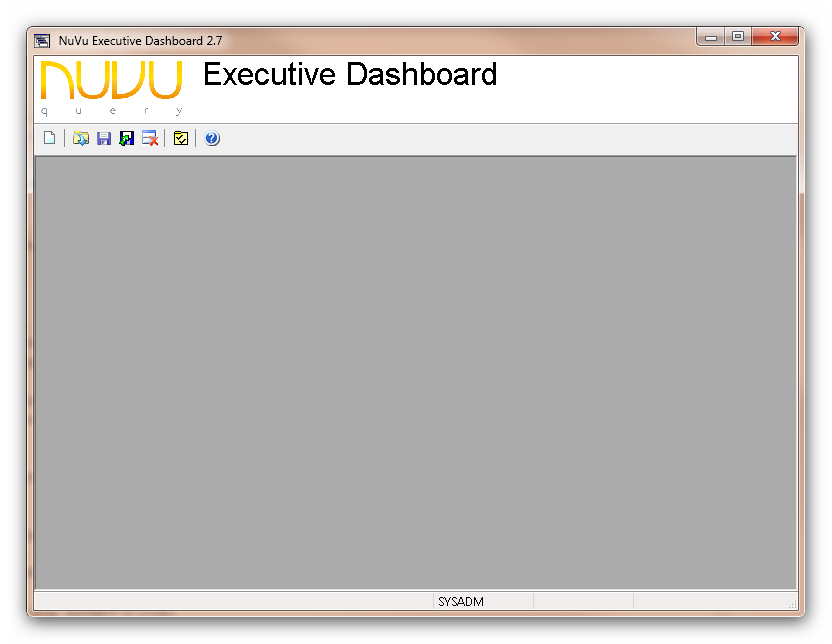
- Invoke the NuVu Executive Dashboard in the NuVu Query program group from the windows Start menu. The main NuVu Executive Dashboard window will be displayed. If you have never invoked this function before, the Dashboard will display the default characteristics (size, colors, logo etc). An example of the default dashboard is shown below:
- You may now use the standard windows functions to resize the dashboard windows to the desired size by dragging the edges of the window, or by using the ‘Maximize’ button to get the dashboard to show maximized into the current desktop window. These settings will be saved for next re-use if you click the
 (Save the dashboard) button.
 - Click the
 (Modify the properties of the dashboard container) button on the toolbar to open the Dashboard Properties window. This will present the following dialog window:
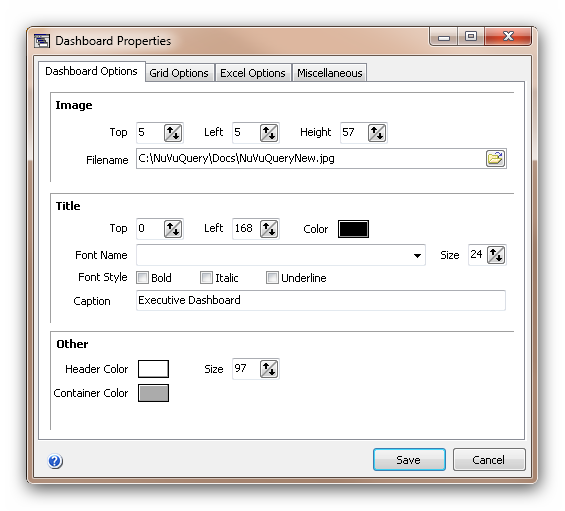
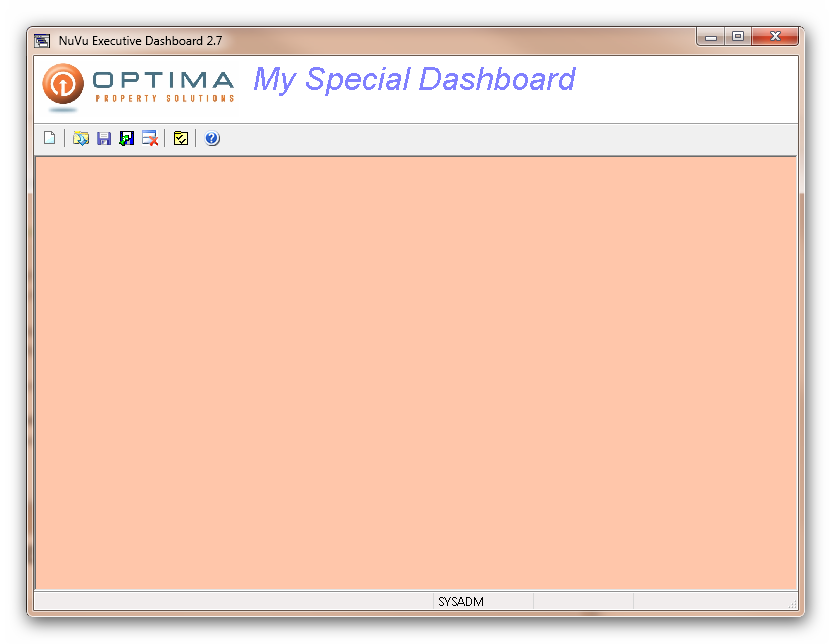
- There are a few sections on the ‘Dashboard Options’ tab. First thing we will do is change the logo that is displayed on the dashboard. Examine the ‘Image’ section within this tab option. Here you can insert a custom logo (your company logo for example). Clicking on the open icon on the right hand side of filename will open the standard windows browse dialog, allowing you to search for any logo that has a .bmp or .jpg extention and associate that logo with the current dashboard. An example of a change to the standard logo is shown here:
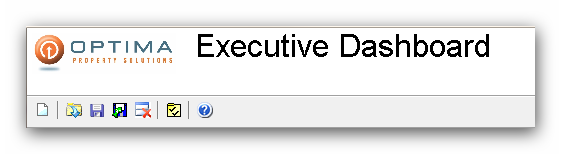
- We can also manipulate the position and size of the logo is displayed within the header section of the dashboard, by simply clicking the small up/down arrows of the ‘Top’, ‘Left’ or ‘Height’ options that are shown within the ‘Image’ section of this tab. Changing any of these options will immediately reflect on the underlying dashboard header section – so use these options until the desired result is achieved.
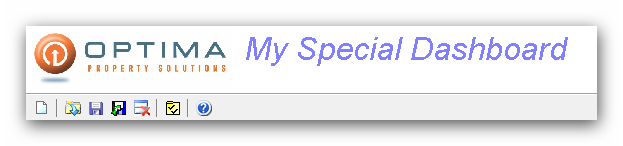
- The title of the dashboard can be changed, by advising a new title, and adjusting the position, size, color and font characteristics under the ‘Title’ section of the ‘Designer Options’ tab. Again, changing any of these options will immediately reflect on the underlying dashboard header section – so use these options until the desired result is achieved. An example of a change to the standard title is shown here:
- The last customization we will do with this tutorial, is change the standard gray background color of the object area (where the Query objects are shown) to a different background color. This information is available within the ‘Other’ section of the ‘Designer Options’ tab. Click on the ‘Container Color’ box to invoke the standard Windows Color Dialog window, allowing you to select the exact color that you wish to display as the background color of the dashboard. The final results of our customization are shown below:
- Once changes have been made to your requirements, this can be saved by clicking the ‘Save’ button on the right bottom of the ‘Dashboard Properties” box.
- We are now finished with the tutorial but need to save the changes that have been made to the executive dashboard, so click the (save) button at the top left hand corner of the dashboard window.
- Finally we will close the dashboard, so simply click the
 button and close down the dashboard.
End of Tutorial